Intro
For my home network I’m using Docker based TICK stack with Graphana. I was looking for a way of pulling some stats from my OpenWRT based router, injecting them into Influxdb and then using Graphana to plot nice graphs. Here is what I did in order to make it work.
Router – IPtables Rules
Firstly, we need to add iptables rules on OpenWRT router to start counting packets and data going through it. An appropriate lines need to be added to file /etc/firewall.user on OpenWRT router, here is an link to example lines. Or lines can be generated for your subnet with the following command, obviously changing subnet part:
for i in {1..254};do echo iptables -t mangle -A FORWARD -d 192.168.0.$i;done
Yes, as you note we create probably more rules than we have devices on the subnet, it doesn’t really make any harm as far as I’m aware.
Router – Processing Script
Right, so we started counting traffic going through router. Next step is to prepare script that parses data gathered by iptables. Save the following code to file /bin/processtraffic.sh
#!/bin/sh

# get the data
# get only info for IP where there is some traffic recorded, discard else
iptables -nvx -t mangle -L FORWARD | grep "all" |grep -v "       0        0" > /tmp/datadump.txt
DATAFILE=/tmp/datadump.txt
echo {
for host in `awk '{print $7}' $DATAFILE |sort |grep -v "0.0.0.0/0"|uniq`
    do
    grep $host $DATAFILE | while read line;
        do
        seventhfield=$(echo "${line}" | awk '{print $7}')
        eighthfield=$(echo "${line}" | awk '{print $8}')
        # work out the direction
        if [ $seventhfield != "0.0.0.0/0" ]; then
                #the direction is outbound from the ip in the seventh field
                # directionOut='out'
                #work out the bytes
                bytesOut=$(echo "${line}" | awk '{print $2}')
        fi
        if [ $eighthfield != "0.0.0.0/0" ]; then
                #the direction is inbound to the ip in the eighth field
                # directionIn='in'
                # ip=$eighthfield
                #work out the bytes
                bytesIn=$(echo "${line}" | awk '{print $2}')
        fi
        statement="\"$host\": { \"in\": $bytesIn, \"out\": $bytesOut },"
        echo $statement
    done

done
echo '"6.6.6.6": { "in": 0, "out": 0 }'
echo }
and make is executable with
chmod +x /bin/processtraffic.sh This is simple code to gather stats for IPs on internal network from OpenWRT based router, based on the following post https://forum.archive.openwrt.org/viewtopic.php?id=13748
with minor tweaks to meet my needs. Instead of pushing gathered data to SQL database as per original post I send it in JSON format to web served directory. It is then consumed by Telegraf service which is pulling data into Influxdb. All credit for the idea goes to the original poster nicknamed nexus.
Router – Cron Job
Next step is to execute script every say 5 minutes, we use cron for that. Edit /etc/crontabs/root and paste the following into it:
*/5 * * * * /bin/processtraffic.sh | grep -v '\"in\"\: \,' > /www/trafficCounters.jsonAs you can see we take advantage of web server service that is installed on router to provide it’s web interface. We put trafficCounters.json file in web directory.
Router – Test json File
Your stats file should be now refreshed every 5 minutes and available under:
http://192.168.0.254/trafficCounters.json
assuming 192.168.0.254 is your router address.
Telegraph – Consuming Data
I’m using Docker based TICK stack with Graphana. Here is my stack definition:
version: '3.7'
services:
  telegraf:
    image: telegraf
    configs:
    - source: telegraf-conf
      target: /etc/telegraf/telegraf.conf
    ports:
    - 8186:8186
    volumes:
    - /usr/share/snmp/mibs:/usr/share/snmp/mibs
    - /var/lib/snmp/mibs/ietf:/var/lib/snmp/mibs/ietf
  influxdb:
    image: influxdb
    ports:
    - 8086:8086
    volumes:
    - /tank/appdata/influxdb:/var/lib/influxdb
  chronograf:
    image: chronograf
    ports:
    - 8888:8888
    command: ["chronograf", "--influxdb-url=http://influxdb:8086"]
  kapacitor:
    image: kapacitor
    environment:
    - KAPACITOR_INFLUXDB_0_URLS_0=http://influxdb:8086
    ports:
    - 9092:9092

configs:
  telegraf-conf:
    name: telegraf.conf-20201107-03
    file: ./telegraf.conf
and here goes telegraf configuration, note inputs.http section
# egrep -v '#|^$' telegraf.conf
[agent]
  interval = "5s"
  round_interval = true
  metric_batch_size = 1000
  metric_buffer_limit = 10000
  collection_jitter = "0s"
  flush_interval = "5s"
  flush_jitter = "0s"
  precision = ""
  debug = false
  quiet = false
  logfile = ""
  hostname = "$HOSTNAME"
  omit_hostname = false
[[outputs.influxdb]]
  urls = ["http://influxdb:8086"]
  database = "test"
  username = ""
  password = ""
  retention_policy = ""
  write_consistency = "any"
  timeout = "5s"
[[inputs.http_listener]]
  service_address = ":8186"
[cpu]
  percpu = true
  totalcpu = true
[[inputs.mem]]
[[inputs.swap]]
[[inputs.system]]
[[inputs.http]]
  name_override = "openwrt"
  urls = [
    "http://192.168.0.254/trafficCounters.json"
  ]
  data_format = "json"
we can now deploy TICK stack with
docker stack deploy tick -c tick.ymlChecking Stack Components
Using Chronograph running on port 8888 we can now explore content hopefully getting into Influxdb. We can also checks logs for any obvious errors if data is not getting through
# list all containers
docker ps

# check influxdb logs
docker logs --tail 50 docker ps|grep influxdb|awk '{print $1}'

# check telegraf logs
docker logs --tail 50 `docker ps|grep telegraf|awk '{print $1}'`
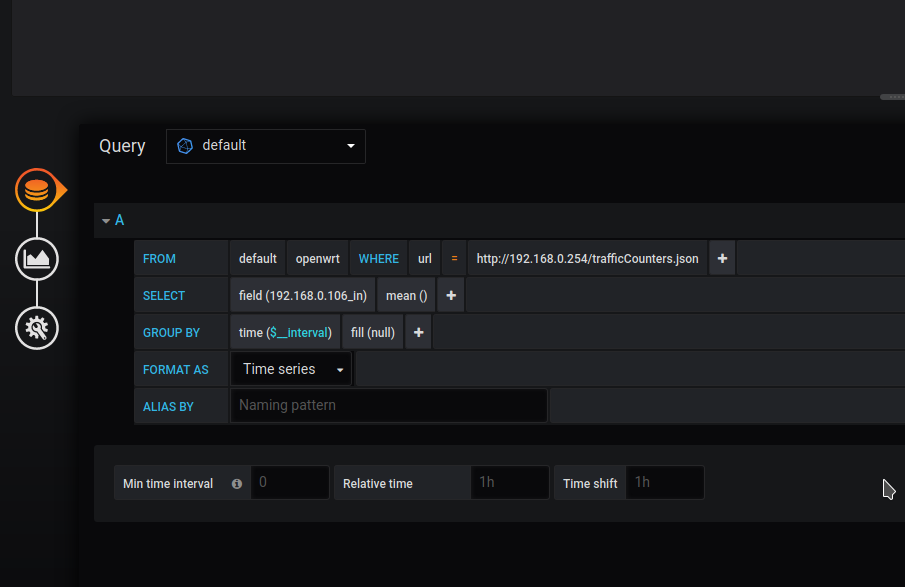
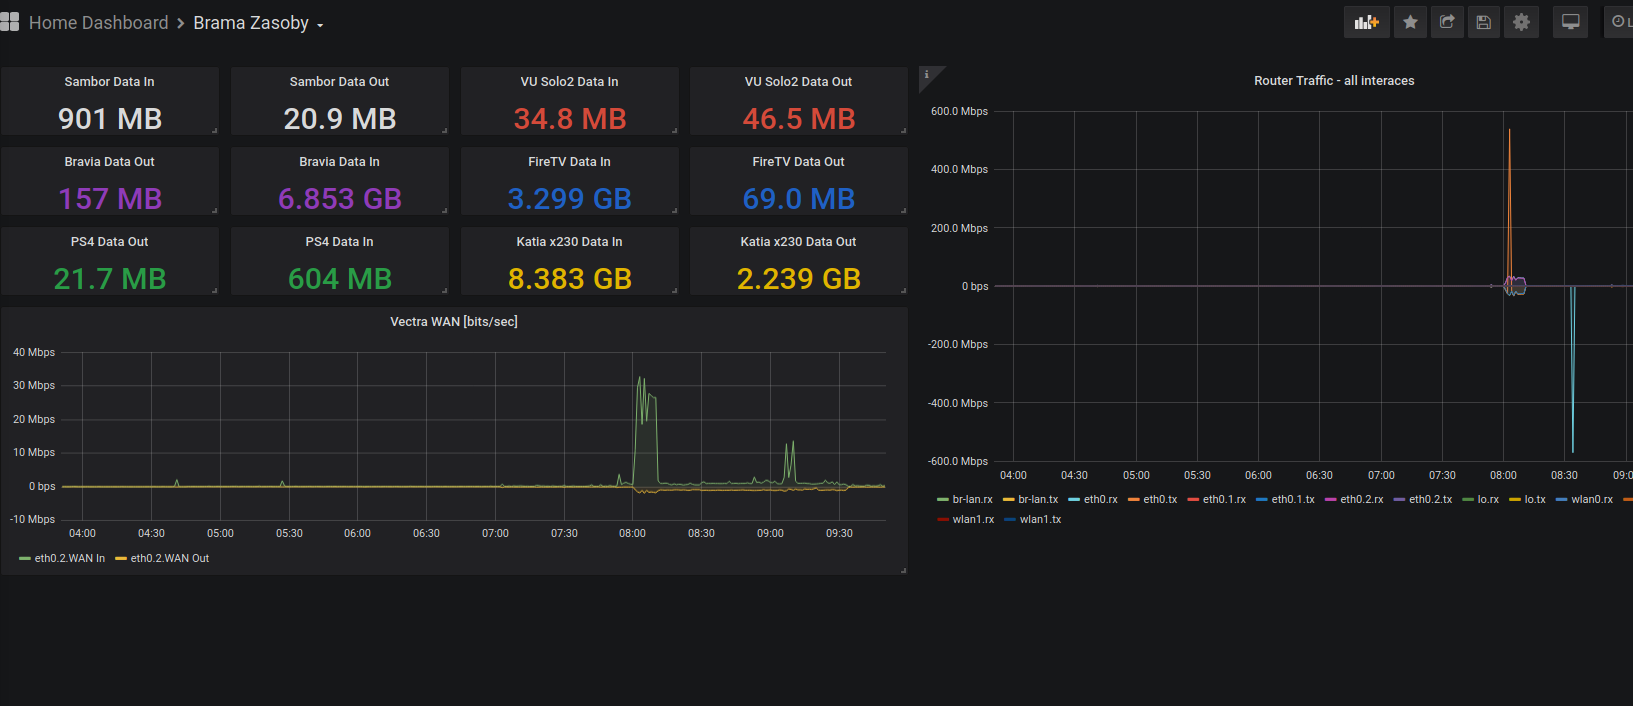
Graphana Dashboard
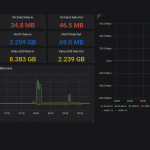
Last step is to create graphs and then put it on a dashboard in Graphana, using data from Influxdb. Plenty of howtos online for this part so I won’t be repeating this here, will just put screenshot or two to show you what I’m using it for:
Summary
That would be really it. It’s very basic and rather rudimentary but it does the job. I keep code for this on GitHub here https://github.com/zmielna/openwrt-traffic-counter so please feel free to take a look and contribute with your improvements should you have any. Thanks very much in advance.