Oct 112025
 

Flight Radar 24 website is offering free premium accounts for contributing members. You can either ask for free device (if you live in the location where they miss data) or build your own feeder based on RaspberryPi device.

Recommended device is version 3B+, which when adding chassis power supply and SD card is coming around 60USD plus…
I wanted to see if I can get similar device working with FR24FEED for cheaper than that.

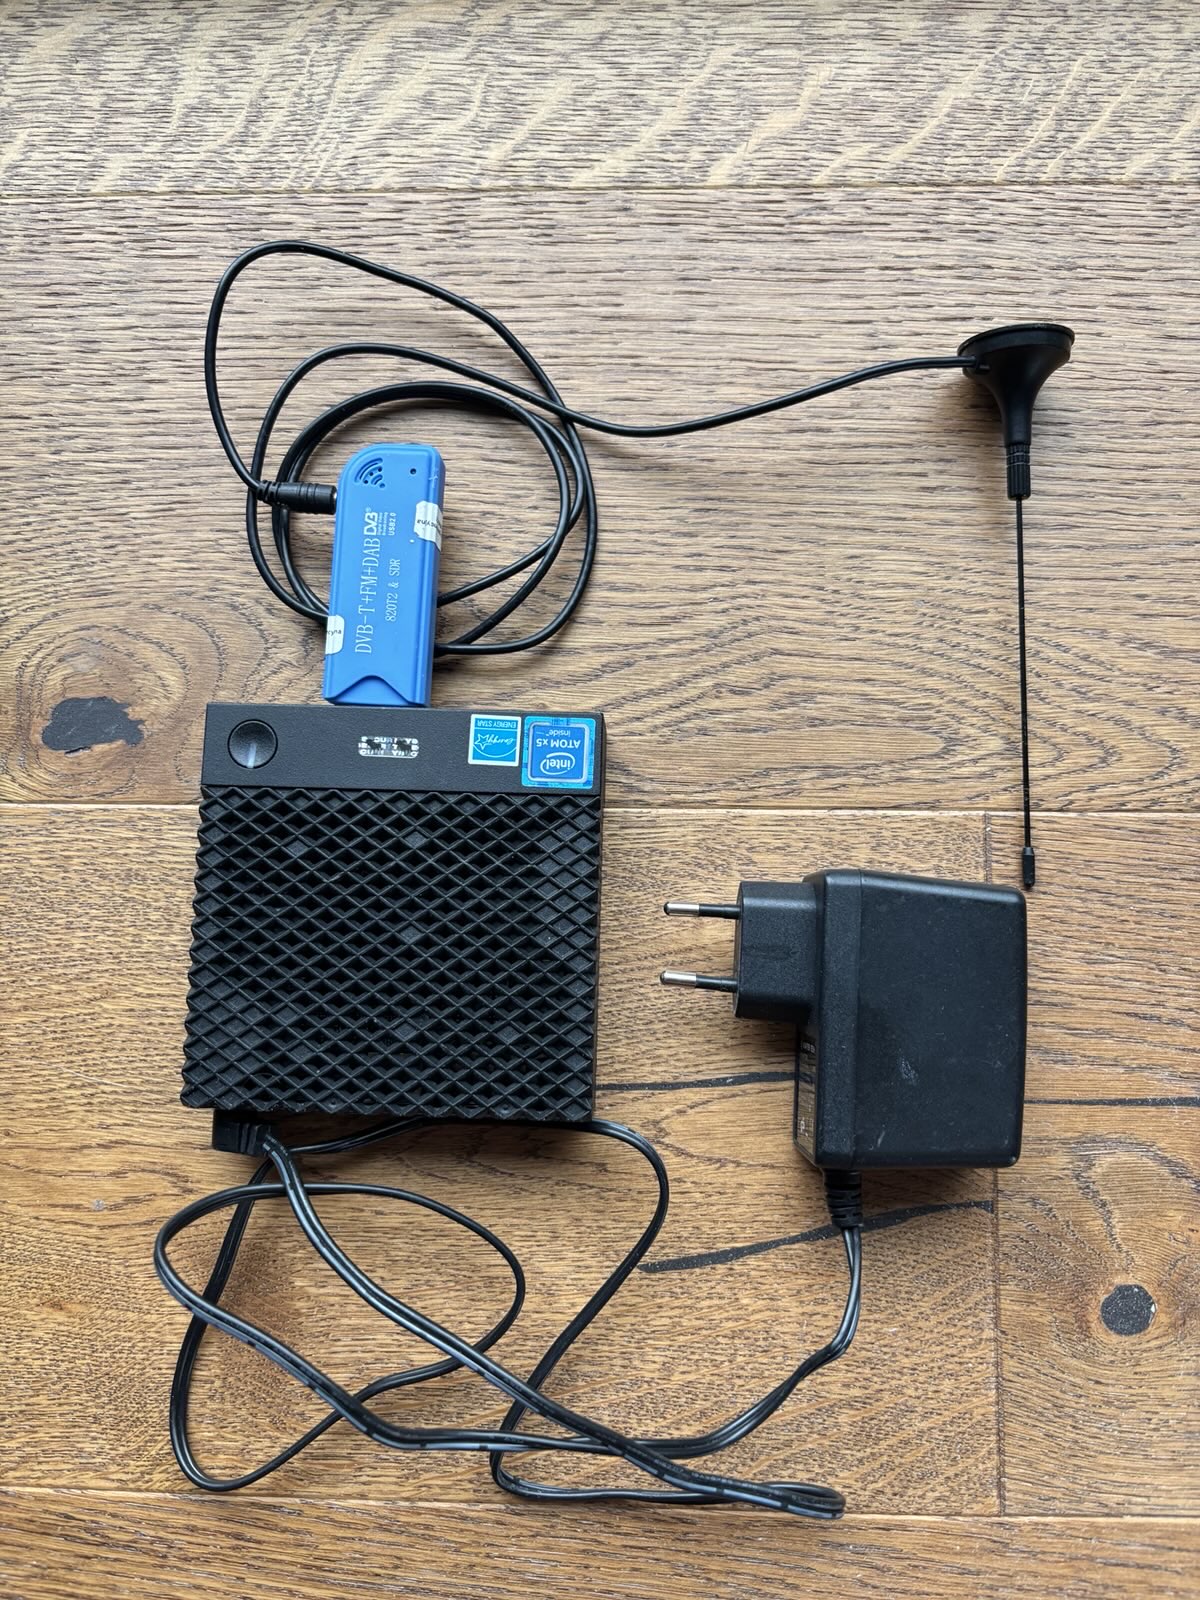
Decided to give Debian powered Dell Wyse 3040 Thin Client a go. Reasons:

  • Price 🙂 got used one in pristine state for equivalent of 21USD delivered
  • Power Efficiency Designed for low power consumption, ideal for battery-operated devices.
  • Quad-Core Performance Four cores provide decent multi-threaded performance for casual computing tasks.
  • Plenty of USB slots
  • and 64bit architecture

Typical Power Consumption for Wyse 3040
State / Power Consumption

  • Idle Approx. 6W
  • Average Use Approx. 10-12W
  • Maximum Up to 15W

Apart of server you also need device that will fetch radio waves, I used DVB-T – USB dongle based on RTL2832U. Interestingly enough, this part is actually more expensive that Wyse device itself, currently around 35USD on my local online market. If you are willing to wait and get it off Aliexpress, you can find these much cheaper. But I had one lying around so no cost from this project’s perspective.

Final Hardware Spec

  • Intel(R) Atom(TM) x5-Z8350 CPU @ 1.44GHz
  • 2GB RAM
  • 8GB embedded MultiMediaCard (eMMC)
  • DVB-T – USB dongle based on RTL2832U

Unfortunately steps for Raspberry listed on Flight Radar website don’t work for amd64 Debian machine due to the fact that dump1060 binary used in script is targeting Raspberry Pi CPU architecture and not amd64. That’s fine – we can download code and built suitable binary ourselves.


Steps taken

  • use your favorite program to prepere bootable USB stick using downloaded ISO
  • Power on Wyse and enter BIOS settings. For me pressing F1 and F2 worked.
  • BIOS settings: power status after power loss – Always on + enable boot from USB
  • Boot from Debian install USB stick, pressing F12 during power up sequence.
  • Follow the flow to install minimal Debian in text mode. Only SSH service is needed.
  • I used LVM based partitioning layout. After install you should end up with around 50% of the space of root disk used.
  • Reboot, make sure you can system boots okay and gets IP address.

From this moment on you can carry on with installation from other device by ssh’ing onto IP address of your feeder. Once connected via SSH download and execute install script. Good idea to download a copy first and review it before executing with root privileges…

wget -qO- https://fr24.com/install.sh | sudo bash -s

You will be prompted to provide your email address. Make sure to use same address that you use with your free Flight Radar account

Once FR24FEED wizard flow is completed don’t start service just yet. Install required packages, clone code, compile library and copy onto required path:


apt-get install git build-essential fakeroot debhelper librtlsdr-dev pkg-config libncurses5-dev libbladerf-dev libhackrf-dev liblimesuite-dev libsoapysdr-dev devscripts
git clone https://github.com/flightaware/dump1090.git
cd dump1090/
make RTLSDR=yes
cp dump1090 /usr/lib/fr24/
/usr/lib/fr24/dump1090 --version
/usr/lib/fr24/dump1090 --interactive

If above commands succeeded and you are able to connect to DVB-T stick and see data coming through – you are good to go to start service.

systemctl enable --now fr24feed

Now you can review status of your feeder by navigating with your web browser to local IP address of your feeder, port 8754
http://10.0.1.191:8754/

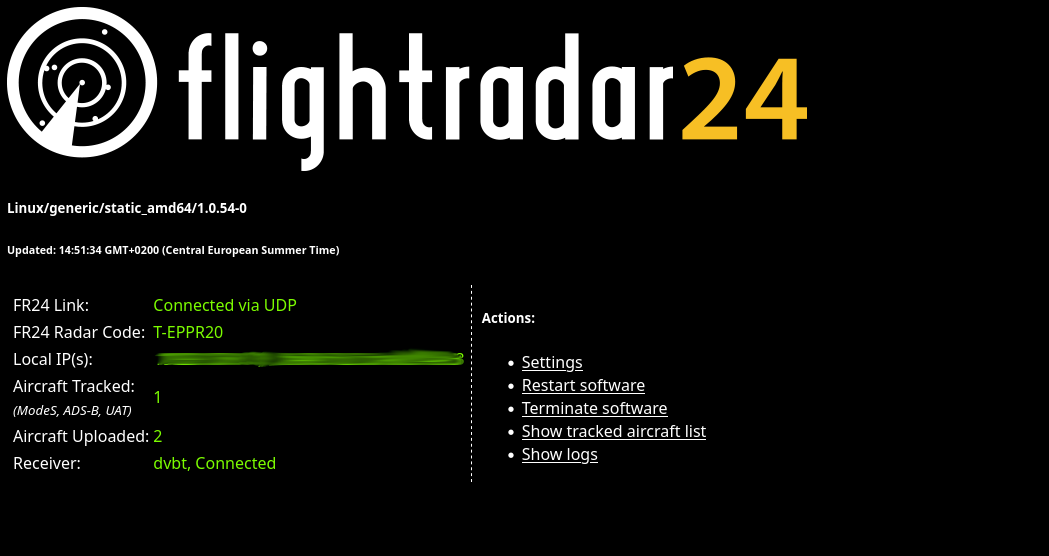
After few hours your free account on Flight Radar 24 will change status to Business – and you start can enjoy using all features.

Bonus content – Ansible playbook for extra steps required

---
- name: Install dump1090 and setup fr24feed
  hosts: all
  become: yes
  tasks:
    - name: Install required packages
      apt:
        name:
          - git
          - build-essential
          - fakeroot
          - debhelper
          - librtlsdr-dev
          - pkg-config
          - libncurses5-dev
          - libbladerf-dev
          - libhackrf-dev
          - liblimesuite-dev
          - libsoapysdr-dev
          - devscripts
        state: present
        update_cache: yes

    - name: Clone dump1090 repository
      git:
        repo: 'https://github.com/flightaware/dump1090.git'
        dest: '/opt/dump1090'

    - name: Compile dump1090
      command: make RTLSDR=yes
      args:
        chdir: '/opt/dump1090'

    - name: Copy dump1090 binary to the specified directory
      command: cp dump1090 /usr/lib/fr24/
      args:
        chdir: '/opt/dump1090'
  
    - name: Check dump1090 version
      command: /usr/lib/fr24/dump1090 --version
      register: dump1090_version_output

    - name: Display dump1090 version
      debug:
        var: dump1090_version_output.stdout

    - name: Run dump1090 in interactive mode
      async: 1
      poll: 0
      command: /usr/lib/fr24/dump1090 --interactive

    - name: Enable and start fr24feed service
      systemd:
        name: fr24feed
        enabled: yes
        state: started

Dec 102020
 

Intro

For my home network I’m using Docker based TICK stack with Graphana. I was looking for a way of pulling some stats from my OpenWRT based router, injecting them into Influxdb and then using Graphana to plot nice graphs. Here is what I did in order to make it work.

Router – IPtables Rules

Firstly, we need to add iptables rules on OpenWRT router to start counting packets and data going through it. An appropriate lines need to be added to file /etc/firewall.user on OpenWRT router, here is an link to example lines. Or lines can be generated for your subnet with the following command, obviously changing subnet part:

for i in {1..254};do echo iptables -t mangle -A FORWARD -d 192.168.0.$i;done

Yes, as you note we create probably more rules than we have devices on the subnet, it doesn’t really make any harm as far as I’m aware.

Router – Processing Script

Right, so we started counting traffic going through router. Next step is to prepare script that parses data gathered by iptables. Save the following code to file /bin/processtraffic.sh

#!/bin/sh

# get the data
# get only info for IP where there is some traffic recorded, discard else
iptables -nvx -t mangle -L FORWARD | grep "all" |grep -v "       0        0" > /tmp/datadump.txt
DATAFILE=/tmp/datadump.txt
echo {
for host in `awk '{print $7}' $DATAFILE |sort |grep -v "0.0.0.0/0"|uniq` 
    do
    grep $host $DATAFILE | while read line;
        do
        seventhfield=$(echo "${line}" | awk '{print $7}')
        eighthfield=$(echo "${line}" | awk '{print $8}')
        # work out the direction
        if [ $seventhfield != "0.0.0.0/0" ]; then
                #the direction is outbound from the ip in the seventh field
                # directionOut='out'
                #work out the bytes
                bytesOut=$(echo "${line}" | awk '{print $2}')
        fi    
        if [ $eighthfield != "0.0.0.0/0" ]; then
                #the direction is inbound to the ip in the eighth field
                # directionIn='in'
                # ip=$eighthfield
                #work out the bytes
                bytesIn=$(echo "${line}" | awk '{print $2}')
        fi 
        statement="\"$host\": { \"in\": $bytesIn, \"out\": $bytesOut }," 
        echo $statement
    done

done
echo '"6.6.6.6": { "in": 0, "out": 0 }'
echo }

and make is executable with

chmod +x /bin/processtraffic.sh 

This is simple code to gather stats for IPs on internal network from OpenWRT based router, based on the following post https://forum.archive.openwrt.org/viewtopic.php?id=13748
with minor tweaks to meet my needs. Instead of pushing gathered data to SQL database as per original post I send it in JSON format to web served directory. It is then consumed by Telegraf service which is pulling data into Influxdb. All credit for the idea goes to the original poster nicknamed nexus.

Router – Cron Job

Next step is to execute script every say 5 minutes, we use cron for that. Edit /etc/crontabs/root and paste the following into it:

*/5 * * * * /bin/processtraffic.sh | grep -v '\"in\"\: \,' > /www/trafficCounters.json

As you can see we take advantage of web server service that is installed on router to provide it’s web interface. We put trafficCounters.json file in web directory.

Router – Test json File

Your stats file should be now refreshed every 5 minutes and available under:

http://192.168.0.254/trafficCounters.json

assuming 192.168.0.254 is your router address.

Telegraph – Consuming Data

I’m using Docker based TICK stack with Graphana. Here is my stack definition:

version: '3.7'
services:
  telegraf:
    image: telegraf
    configs:
    - source: telegraf-conf
      target: /etc/telegraf/telegraf.conf
    ports:
    - 8186:8186
    volumes:
    - /usr/share/snmp/mibs:/usr/share/snmp/mibs
    - /var/lib/snmp/mibs/ietf:/var/lib/snmp/mibs/ietf
  influxdb:
    image: influxdb
    ports:
    - 8086:8086
    volumes:
    - /tank/appdata/influxdb:/var/lib/influxdb
  chronograf:
    image: chronograf
    ports:
    - 8888:8888
    command: ["chronograf", "--influxdb-url=http://influxdb:8086"]
  kapacitor:
    image: kapacitor
    environment:
    - KAPACITOR_INFLUXDB_0_URLS_0=http://influxdb:8086
    ports:
    - 9092:9092

configs:
  telegraf-conf:
    name: telegraf.conf-20201107-03
    file: ./telegraf.conf

and here goes telegraf configuration, note inputs.http section

# egrep -v '#|^$' telegraf.conf
[agent]
  interval = "5s"
  round_interval = true
  metric_batch_size = 1000
  metric_buffer_limit = 10000
  collection_jitter = "0s"
  flush_interval = "5s"
  flush_jitter = "0s"
  precision = ""
  debug = false
  quiet = false
  logfile = ""
  hostname = "$HOSTNAME"
  omit_hostname = false
[[outputs.influxdb]]
  urls = ["http://influxdb:8086"]
  database = "test"
  username = ""
  password = ""
  retention_policy = ""
  write_consistency = "any"
  timeout = "5s"
[[inputs.http_listener]]
  service_address = ":8186"
[cpu]
  percpu = true
  totalcpu = true
[[inputs.mem]]
[[inputs.swap]]
[[inputs.system]]
[[inputs.http]]
  name_override = "openwrt"
  urls = [
    "http://192.168.0.254/trafficCounters.json"
  ]
  data_format = "json"

we can now deploy TICK stack with

docker stack deploy tick -c tick.yml

Checking Stack Components

Using Chronograph running on port 8888 we can now explore content hopefully getting into Influxdb. We can also checks logs for any obvious errors if data is not getting through

# list all containers
docker ps

# check influxdb logs
docker logs --tail 50 docker ps|grep influxdb|awk '{print $1}'

# check telegraf logs
docker logs --tail 50 `docker ps|grep telegraf|awk '{print $1}'`

Graphana Dashboard

Last step is to create graphs and then put it on a dashboard in Graphana, using data from Influxdb. Plenty of howtos online for this part so I won’t be repeating this here, will just put screenshot or two to show you what I’m using it for:

Summary

That would be really it. It’s very basic and rather rudimentary but it does the job. I keep code for this on GitHub here https://github.com/zmielna/openwrt-traffic-counter so please feel free to take a look and contribute with your improvements should you have any. Thanks very much in advance.