Intro
I’ve been searching long for a monitoring solution that will fit my needs. Tested the usual suspects like Nagios or Zabbix and I wasn’t impressed. At some point friend of mine recommended OMD – The Open Monitoring Distribution, initial tests were promising so I went with full scale deployment. Thanks Lysy!

After more than a year spent with it I can certainly say I loved it – elegant, flexible and simple solution. Currently monitoring around 100 machines and the whole thingy happily runs on relatively lightweight (2 vCores, 2GB RAM) Debian based VM.
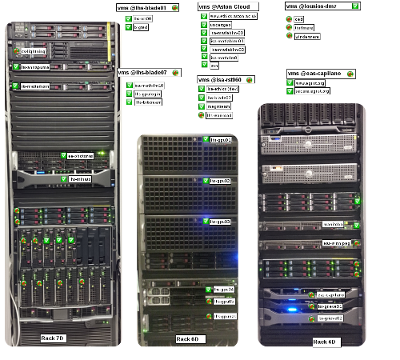
Another useful feature comes with bundled Nagvis – it allows for pictures of the racks to be used as backgrounds of “maps”, to visualise and quickly identify problematic server:
Adding new host/checks is as simple as:
- edit a single file ~/etc/check_mk/main.mk
- re-generate configuration and restart services with cmk -O
- that’s it
At the core of OMD lies Check_MK combined with Icinga – what I especially liked about it is how easy it is to define and run local checks. Think about it as custom scripts that do some stuff and return output to monitoring server. Only your imagination is a limit here, among the things I monitor with local checks are:
- available tapes in tape library (warning when 2 tapes and critical when only 0 free tapes left)
- detailed status of RAID controller (pulling details with omreport, hpacucli or MegaCli64)
- status of license servers
- Grid Engine queue status
- ThinLinc server status
- and more…
Adding local check is easy, assuming check_mk agent is installed simply drop your script inside /usr/lib/check_mk_agent/local/ – during the next run check_mk will execute it and pass the result to the server. Doesn’t matter what scripting language you use, as long as output is a text string matching check_mk expectations.
Testing is also easy, simply telnet from server to port 6556 of your client and you’ll find local check results at the bottom of the status returned.
Anyway, this is my online notepad so there we go:
Adding client:
Preferably automated with Puppet. But for standalone hosts, manual installation, depending on OS can be triggered
wget http://monitoring.server/service/debian.sh && bash debian.sh
or
wget http://monitoring.server/service/rh.sh && bash rh.sh
I know, blindly executing bash scripts as root, yay! Here goes debian.sh:
wget http://monitoring.server/service/check-mk-agent_1.2.4p5-2_all.deb
wget http://monitoring.server/service/check-mk-agent-logwatch_1.2.4p5-2_all.deb
apt-get install xinetd snmpd -y
dpkg -i check-mk-agent_1.2.4p5-2_all.deb check-mk-agent-logwatch_1.2.4p5-2_all.deb
wget http://monitoring.server/service/snmpd.conf -O /etc/snmp/snmpd.conf
wget http://monitoring.server/service/snmpdDebian -O /etc/default/snmpd
wget http://monitoring.server/service/check_mk -O /etc/xinetd.d/check_mk
service snmpd restart
and rh.sh has
wget http://monitoring.server/service/check_mk-agent-1.2.4p5-1.noarch.rpm
wget http://monitoring.server/service/check_mk-agent-logwatch-1.2.4p5-1.noarch.rpm
yum install xinetd net-snmp -y
rpm -Uvh check_mk-agent-1.2.4p5-1.noarch.rpm check_mk-agent-logwatch-1.2.4p5-1.noarch.rpm
wget http://monitoring.server/service/snmpd.conf -O /etc/snmp/snmpd.conf
wget http://monitoring.server/service/snmpd -O /etc/sysconfig/snmpd
wget http://monitoring.server/service/check_mk -O /etc/xinetd.d/check_mk
service snmpd restart
chkconfig snmpd on
echo "Add this line to /etc/sysconfig/iptables before REJECT"
echo "-A INPUT -s 10.100.10.5 -j ACCEPT"
echo "and then"
echo "service iptables restart"
My copy of /etc/xinetd.d/check_mk has “only_from = monitoring.server” line in it so we do have some sort of protection.
Modify local firewall ingress rules too, in order to accept check_mk 6556/udp traffic from management server only.
Defining client on server:
ssh monitoring.server
sudo su - mysite
vim ~/etc/check_mk/main.mk
See documentation for more details on how to fill this file.
Local checks, starting with Monitoring Available Bacula Tapes
Cronjob gathers information about tape library status twice a day:
crontab -l
0 8,16 * * * /usr/local/bin/baculaTapes.sh
Actual cron script:
#!/bin/bash
echo "status slots Storage=Autochanger"| bconsole > /var/tmp/bacula.out
Now, we use check_mk agent capability to run local checks with the following script, vim /usr/lib/check_mk_agent/local/bacula_tapes.sh
#!/bin/bash
ERRORTAPES=`grep Error /var/tmp/bacula.out|wc -l`
APPENDTAPES=`egrep 'Append|Purged' /var/tmp/bacula.out|wc -l`
FULLTAPES=`grep Full /var/tmp/bacula.out|wc -l`

if [ $APPENDTAPES -lt 2 ] ; then
status=2
statustxt=CRITICAL
elif [ $APPENDTAPES -lt 3 ] || [ $ERRORTAPES -gt 0 ] ; then
status=1
statustxt=WARNING
else
status=0
statustxt=OK
fi

echo "$status Backup_AvailableTapes APPENDTAPES=$APPENDTAPES;3;1;25; $statustxt - $APPENDTAPES Usable Tapes, $FULLTAPES Full Tapes, $ERRORTAPES Error Tapes"
Ubuntu security patches
On some server we don’t enable automated patching (especially Ubuntu!) but we want to know if there are security patches available in order to apply them in controlled manner. We rely on update-notifier-common so make sure it’s installed.
vim /usr/lib/check_mk_agent/local/ububtu-security-updates.sh
#!/bin/bash
SECUPD=`/usr/lib/update-notifier/update-motd-updates-available|tail -n2|head -n1|cut -d" " -f1`
SECTEXT=`/usr/lib/update-notifier/update-motd-updates-available |xargs`

if [ $SECUPD -gt 2 ] ; then
        status=2
        statustxt=CRITICAL
elif [ $SECUPD -gt 1 ] ; then
        status=2
        statustxt=WARNING
else
        status=0
        statustxt=OK
fi


echo "$status UBUNTU_SECURITY PACKAGES=$SECUPD;1;5 $statustxt - $SECTEXT"
SAMBA status
/usr/lib/check_mk_agent/local/samba-test.sh
#!/bin/bash
SESSIONS=`smbstatus -b -d 0|egrep '^[0-9]'|wc -l|tr -d ' '`
if [ $SESSIONS -gt 200 ] ; then
        status=2
        statustxt=CRITICAL
else
        status=0
        statustxt=OK
fi


echo "$status SAMBA USERS=$SESSIONS;200;300 $statustxt - $SESSIONS user sessions, `smbstatus -d0 |grep version`"
FreeNX
/usr/lib/check_mk_agent/local/FreeNXusers.sh
#!/bin/bash
SESSIONS=`nxserver --list|grep abc|wc -l`
STRING=`nxserver --status|tail -n2|head -n1`
STRINGOK="NX> 110 NX Server is running"
# STRINGOK="110 NX Server is running"
if [ "$STRING" == "$STRINGOK" ];
then
status=0
statustxt=OK
else
status=2
statustxt=CRITICAL
fi
echo "$status FreeNX SESSIONS=$SESSIONS;25;30 $statustxt - $STRING, $SESSIONS users currently logged in"
SunRAY
/usr/lib/check_mk_agent/local/SunRayUsers.sh
#!/bin/bash
CARDS=`/opt/SUNWut/sbin/utsession -p|egrep 'Payflex'|wc -l`
SESSIONS=`/opt/SUNWut/sbin/utsession -p|egrep 'Payflex|pseudo'|wc -l`

if [ $SESSIONS -lt 1 ] ; then
status=2
statustxt=CRITICAL
elif [ $SESSIONS -lt 3 ] ; then
status=1
statustxt=WARNING
else
status=0
statustxt=OK
fi
echo "$status SunRays USERS=$CARDS;28;30 $statustxt - $SESSIONS Sunrays connected, $CARDS users currently logged in"
ThinLinc server
/usr/lib/check_mk_agent/local/ThinLinc.sh
#!/bin/bash
SESSIONS=`who|wc -l`
ThinLinc=`tail -n1 /var/log/thinlinc-user-licenses`
SERVICES=`for i in vsmserver vsmagent; do service $i status;done|grep running|wc -l`

if [ $SERVICES -lt 2 ] ; then
status=2
statustxt=CRITICAL
else
status=0
statustxt=OK
fi

echo "$status ThinLinc USERS=$SESSIONS;28;30 $statustxt - $SESSIONS sessions, $ThinLinc"
Grid Engine queue status
Dirty script to check number of online workers. First root outputs status of the queue (so check_mk doesn’t need access to SGE environment) to temp file then check_mk local check scans output temp file.
vim /usr/local/bin/sge.sh
#!/bin/bash
. /etc/profile.d/sge.sh
/apps/sge/bin/lx24-amd64/qstat -f -u "*" > /tmp/sge.status
Trigger every 5 minutes
crontab -l
*/5 * * * * /usr/local/bin/sge.sh
Actual local check /usr/lib/check_mk_agent/local/sge.sh
#!/bin/bash
OFFLINE=`cat /tmp/sge.status|grep au|wc -l`
ONLINE=`cat /tmp/sge.status|grep BIP|wc -l`

if [ "$OFFLINE" == 0 ];
then
status=0
statustxt=OK
else
status=2
statustxt=CRITICAL
fi

echo "$status GridEngine OFFLINE=$OFFLINE;1;2 $statustxt - $ONLINE out of 3 SGE workers online"
Dell PERC RAID status
cronjob
*/15 * * * * /usr/local/bin/raid.sh
where /usr/local/bin/raid.sh
#!/bin/bash
omreport storage vdisk controller=0  > /var/tmp/raid.txt
omreport storage pdisk controller=0  >> /var/tmp/raid.txt
and actual check_mk local check /usr/lib/check_mk_agent/local/raid.sh has:
#!/bin/bash
ONLINEDISKS=`grep Online /var/tmp/raid.txt|wc -l`
VDISKSTATUS=`head -n10 /var/tmp/raid.txt|grep Status|awk -F" " '{print $3}'`

if [ $ONLINEDISKS -lt 3 ] ; then
status=2
statustxt=CRITICAL
else
status=0
statustxt=OK
fi

echo "$status PERC_H310_Mini_Status ONLINEDISKS=$ONLINEDISKS;3;1;25; $statustxt – $ONLINEDISKS Online Disks in 3x RAID5. Vdisk status $VDISKSTATUS"
HP Smart Array P400
vim /usr/local/bin/raid.sh
#!/bin/bash
/usr/sbin/hpacucli ctrl slot=0 physicaldrive all show status > /var/tmp/raid-p.txt
/usr/sbin/hpacucli ctrl slot=0 logicaldrive all show status > /var/tmp/raid-v.txt
crontab -l
*/5 * * * * /usr/local/bin/p400.sh
vim /usr/lib/check_mk_agent/local/raid.sh
#!/bin/bash
ONLINEDISKS=`grep physicaldrive /var/tmp/raid-p.txt|wc -l`
HOTSPARE=`grep spare /var/tmp/raid-p.txt|wc -l`
VDISKSTATUS=`grep logicaldrive /var/tmp/raid-v.txt`

if [ $ONLINEDISKS -lt 12 ] ; then
status=2
statustxt=CRITICAL
else
status=0
statustxt=OK
fi

# varname=value;warn;crit;min;max, while the values ;warn;crit;min;max are optional values.
# varname=value;warn;crit

echo "$status SmartArrayP400 ONLINEDISKS=$ONLINEDISKS;11;10 $statustxt - $ONLINEDISKS Online disks: $HOTSPARE HotSpare, Vdisk status:$VDISKSTATUS"
Supermicro LSI Mega RAID SAS 9240-8i
cron
*/5 * * * * /usr/local/bin/raid.sh
vim /usr/local/bin/raid.sh
#!/bin/bash
/usr/local/bin/MegaCli64 -PDList -aALL|grep "Firmware state"|wc -l > /var/tmp/raid-p.txt
/usr/local/bin/MegaCli64 -PDList -aALL|grep "Firmware state"|grep Hotspare|wc -l > /var/tmp/raid-hs.txt
/usr/local/bin/MegaCli64 -LDInfo -Lall -aALL > /var/tmp/raid-v.txt
vim /usr/lib/check_mk_agent/local/raid.sh
#!/bin/bash
ONLINEDISKS=`cat /var/tmp/raid-p.txt`
HOTSPARE=`cat /var/tmp/raid-hs.txt`
VDISKSTATUS=`cat /var/tmp/raid-v.txt|grep State|xargs`

if [ $ONLINEDISKS -lt 12 ] ; then
status=2
statustxt=CRITICAL
else
status=0
statustxt=OK
fi

# varname=value;warn;crit;min;max, while the values ;warn;crit;min;max are optional values.
# varname=value;warn;crit

echo "$status LSIMegaRAID9240-8i ONLINEDISKS=$ONLINEDISKS;13;12 $statustxt - $ONLINEDISKS Online disks: $HOTSPARE HotSpare, Vdisks: $VDISKSTATUS"
Bonus, monitoring ESXi with OMD
Not really a local check but took me a while to figure out hot to pull status from standalone ESXi server so adding for reference. Add user on ESXi and grant R/O access. Test from CLI to make sure we’ve got it right
/omd/sites/mysite/share/check_mk/agents/special/agent_vsphere -D --debug -u 'xxxxxxxxxx' -s 'xxxxxxxxx' -i hostsystem,virtualmachine,datastore,counters --timeout 5 esxhost01.domain
Add to etc/check_mk/main.mk:
#-- Custom checks for ESXi servers ---
datasource_programs.append((
"/omd/sites/mysite/share/check_mk/agents/special/agent_vsphere -u 'xxxxxxxxx' -s 'xxxxxxxxxxxx' "
"-i hostsystem,virtualmachine,datastore,counters --direct "
"--hostname '<HOST>' --timeout 5 <IP>", [ "esxhost01.domain" ]
))
Bonus 2: Monitoring execution of Bacula backup jobs
That mechanism pulls job status from MySQL database and flags up job that hasn’t been successfully executed during the last say 25h (for daily jobs).
File /opt/omd/sites/prod/etc/nagios/conf.d/templates.cfg has the following generic service defined:
define service{
 name bacula-prod-backup-generic-service
 host_name prod-backup
 service_description check-production-backup-jobs
 check_command check_bacula_at_prod-backup
 servicegroups backup-servers
 active_checks_enabled 1 ; Active service checks are enabled
 passive_checks_enabled 1 ; Passive service checks are enabled/accepted
 parallelize_check 1 ; Active service checks should be parallelized (disabling this can lead to major performance problems)
 obsess_over_service 1 ; We should obsess over this service (if necessary)
 check_freshness 0 ; Default is to NOT check service 'freshness'
 notifications_enabled 1 ; Service notifications are enabled
 event_handler_enabled 1 ; Service event handler is enabled
 failure_prediction_enabled 1 ; Failure prediction is enabled
 process_perf_data 1 ; Process performance data
 retain_status_information 1 ; Retain status information across program restarts
 retain_nonstatus_information 1 ; Retain non-status information across program restarts
 notification_interval 0 ; Only send notifications on status change by default.
 is_volatile 0
 check_period 24x7
 normal_check_interval 5
 retry_check_interval 1
 max_check_attempts 4
 notification_period 24x7
 notification_options w,u,c,r
 # contact_groups admins
 register 0 ; DONT REGISTER THIS DEFINITION - ITS NOT A REAL SERVICE, JUST A TEMPLATE!
 }
File /opt/omd/sites/prod/etc/nagios/conf.d/bacula_prod-backup.cfg has one service per job defined
define service {
use bacula-prod-backup-generic-service
service_description Backup: Studies2010-1
check_command check_bacula_at_prod-backup!744!1!1!Studies2010-1
}
define service {
use bacula-prod-backup-generic-service
service_description Backup: Studies2010-2
check_command check_bacula_at_prod-backup!744!1!1!Studies2010-2
}
define service {
use bacula-prod-backup-generic-service
service_description Backup: Studies2010-3
check_command check_bacula_at_prod-backup!744!1!1!Studies2010-3
}
and so on.
and file /opt/omd/sites/prod/etc/nagios/conf.d/commands.cfg has the following command defined
define command {
 command_name check_bacula_at_prod-backup
 command_line $USER2$/check_bacula_prod-backup.pl -H '$ARG1$' -w '$ARG2$' -c '$ARG3$' -j '$ARG4$'
}
Finally, Perl script /omd/sites/prod/local/lib/nagios/plugins/check_bacula_prod-backup.pl has bacula database connection details embedded (sql user with R/O privileges is fine). I got a copy of check_bacula.pl version 0.0.3 from Bacula website, submitted by Julian Hein NETWAYS GmbH and modified by Silver Salonen – good job gentlemen.
Bonus 3, monitoring NAS4FREE with OMD
Click here.
Thanks
And the final note, many thanks to Mathias Kettner and his team for providing this fantastic tool under GPL license. Well done chaps.