Case study
I needed central logging system and with ELK stack (Elasticsearch Logstash Kibana) becoming de facto a standard for this kind of operation, I decided to give it a shot.
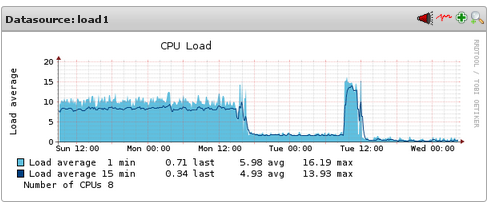
Standard ELK stack worked well for few months, until I started increasing number of clients logging to it. At some point (more that 100 clients) I started seeing load shooting up to the roof and Elasticsearch choking. Poor Elasticsearch.
True that my two node cluster runs on fairly old hardware taken from the bin and reused (2x ProLiant DL160 G5, each with dual E5405 @2.00GHz and 40GB RAM) but still, something wasn’t quite right.
Introducing Redis to the team
Then I’ve added Redis and oh my, difference was HUGE, like going down from load 10 to load 0.3
The only caveat, I use logstash-forwarder on clients, with SSL certificate encrypting logs before transmission. There is no way Redis can decrypt that (can it?) so what we need is two separate instances of Logstash on the log server:
- first Logstash instance (referred later as Logstash shipper ) listens on some network port, accepts communication from logstash-forwarder installed on client, decrypts data and feeds into Redis
- second Logstash instance (referred later as Logstash processor) pulls data from Redis, processes it and puts in Elasticsearch engine.
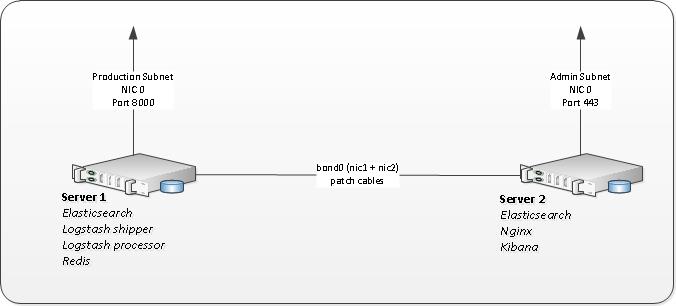
Layout
- Elasticsearch runs on both nodes as a single cluster.
- Logstash runs on Server1
- Redis runs on Server1
- Kibana behind Nginx runs on Server2
Installing Redis
My configuration is fairly standard. No need for this service to be accessed from outside so we could block access on firewall and/or bind to localhost in config file.
# egrep -v '^$|^#' /etc/redis/redis.conf
daemonize yes
pidfile /var/run/redis/redis-server.pid
port 6379
bind 0.0.0.0
timeout 0
loglevel notice
logfile /var/log/redis/redis-server.log
databases 16
save 900 1
save 300 10
save 60 10000
rdbcompression yes
dbfilename dump.rdb
dir /var/lib/redis
slave-serve-stale-data yes
appendonly no
appendfsync everysec
no-appendfsync-on-rewrite no
auto-aof-rewrite-percentage 100
auto-aof-rewrite-min-size 64mb
slowlog-log-slower-than 10000
slowlog-max-len 128
vm-enabled no
vm-swap-file /var/lib/redis/redis.swap
vm-max-memory 0
vm-page-size 32
vm-pages 134217728
vm-max-threads 4
hash-max-zipmap-entries 512
hash-max-zipmap-value 64
list-max-ziplist-entries 512
list-max-ziplist-value 64
set-max-intset-entries 512
zset-max-ziplist-entries 128
zset-max-ziplist-value 64
activerehashing yes
# EOF

# /etc/init.d/redis-server start
# netstat -nelp |grep 6379
tcp 0 0 0.0.0.0:6379 0.0.0.0:* LISTEN 109 6566 2548/redis-server
Installing Logstash
Start with installing Logstash package provided by good folks at Elastic.
Once done copy logstash init script and change LS_HOME, LS_LOG_DIR and LS_CONF_DIR variables
# cp /etc/init.d/logstash /etc/init.d/logstash-shipper

# diff /etc/init.d/logstash /etc/init.d/logstash-shipper
26c26
< name=logstash
---
> name=logstash-shipper
31c31
< LS_HOME=/var/lib/logstash
---
> LS_HOME=/var/lib/logstash-shipper
33c33
< LS_LOG_DIR=/var/log/logstash
---
> LS_LOG_DIR=/var/log/logstash-shipper
35c35
< LS_CONF_DIR=/etc/logstash/conf.d
---
> LS_CONF_DIR=/etc/logstash-shipper/conf.d
Next, create a copies of each directory so second instance of Logstash has its own environment.
rsync -av /var/lib/logstash /var/lib/logstash-shipper
rsync -av /var/log/logstash /var/log/logstash-shipper
rsync -av /etc/logstash/conf.d /etc/logstash-shipper/conf.d
I run Debian but same sort of thing can be done for RHEL family of course.
Configuring Logstash shipper
Maybe name shipper is not particularly fortunate choice for this bit – by shipper I mean here network service that is shipping log to Redis. Only single file to configure:
vim /etc/logstash-shipper/conf.d/01-lumberjack-input.conf
input {
  lumberjack {
        port => 8000
        type => "logs"
        ssl_certificate => "/etc/pki/tls/certs/logstash-forwarder.crt"
        ssl_key => "/etc/pki/tls/private/logstash-forwarder.key"
               }
    }

output {
  redis {
        host => "localhost"
        data_type => "list"
        key => "logstash"
        congestion_interval => 1
        congestion_threshold => 20000000
        workers => 8
        batch => true
        batch_events => 50
        batch_timeout => 5
  }
}
Alright, put SSL certificate/key in place, start service and make sure it’s listening. Make sure to punch a hole for it in firewall.
# /etc/init.d/logstash-shipper start

# netstat -nelp |grep 8000
tcp6       0      0 :::8000                 :::*                    LISTEN      999        36239997    7777/java

# ufw allow 8000
Configuring Logstash processor
I decided to split my Logstash processor configuration into a chunks of code
# ls /etc/logstash/conf.d
02-redis-to-logstash.conf   12-nginx-filter.conf   16-matlab-filter.conf
10-apache-filter.conf	    14-syslog-filter.conf  17-mathematica-filter.conf
11-apache-json-filter.conf  15-nagios-filter.conf  30-lumberjack-output.con
with the input being
# cat /etc/logstash/conf.d/02-redis-to-logstash.conf
input {
  redis {
    host => "localhost"
    data_type => "list"
    type => "redis-input"
    key => "logstash"
    # threads => 1
    # batch_count => 2
  }
}
and the output to ElASTICSEARCH
# cat /etc/logstash/conf.d/30-lumberjack-output.conf

output {
    elasticsearch {
                hosts => ["10.0.0.1", "10.0.0.2"]
		workers => 4
		  }
# uncommenting below will start outputting
# to /var/log/logstash/logstash.stdout
# useful for debugging
#    stdout { codec => rubydebug }
      }
Note, addresses 10.0.0.1 and 10.0.0.2 are assigned to internal cluster subnet. Essentially these servers have three NICs each, with first NIC connected to production or admin network and second/third bonded NICs patched with cables.
Finally, configure in your elasticsearch.yml binding to cluster subnet only to ensure that all Elasticsearch related traffic is purely local to cluster and that it doesn’t hit external NIC.
Kibana
This bit runs on second node in cluster. Configuration is simple. Really.
# egrep -v ‘^$|^#’ /etc/kibana/kibana.yml
elasticsearch.url: "http://10.0.0.1:9200"
Nginx
In order to protect Kibana dashboard I’ve put it behind Nginx
# egrep -v ‘^$|^#’ /etc/nginx/sites-enabled/default
    server {
    listen 443 ssl;
    server_name log-server.mielnet.pl;
    server_tokens off;
    auth_basic "Restricted Access";
    auth_basic_user_file /etc/nginx/htpasswd.users;
    ssl on;
    ssl_certificate /etc/pki/tls/certs/logstash-forwarder.crt;
    ssl_certificate_key /etc/pki/tls/private/logstash-forwarder.key;
    ssl_protocols  TLSv1 TLSv1.1 TLSv1.2;
    ssl_session_cache  builtin:1000  shared:SSL:10m;
    ssl_session_timeout  5m;
    # ssl_prefer_server_ciphers on;
    ssl_prefer_server_ciphers on;
    ssl_ciphers "EECDH+ECDSA+AESGCM EECDH+aRSA+AESGCM EECDH+ECDSA+SHA384 EECDH+ECDSA+SHA256 EECDH+aRSA+SHA384 EECDH+aRSA+SHA256 EECDH+aRSA+RC4 EECDH EDH+aRSA RC4 !aNULL !eNULL !LOW !3DES !MD5 !EXP !PSK !SRP !DSS";
    location / {
    proxy_pass http://localhost:5601;
    proxy_http_version 1.1;
    proxy_set_header Upgrade $http_upgrade;
    proxy_set_header Connection 'upgrade';
    proxy_set_header Host $host;
    proxy_cache_bypass $http_upgrade;
    }
    }
I’m using same SSL certificate that is being used with Logstash. Generating self signed SSL certificate is covered here.
File /etc/nginx/htpasswd.users can be created with htpasswd that comes with apache2-utils package.
Firewall
Only port 8000 on Server1 should be available from your clients.
Configure Server1 firewall to
- allow all on cluster internal NICs,
- allow 8000/tcp from clients
- allow ssh (22/tcp) from admin workstation
- deny everything else
Configure Server2 firewall to
- allow all on cluster internal NICs,
- allow https (443/tcp) from admin workstation (access to Kibana)
- allow ssh (22/tcp) from admin workstation
- deny everything else
Connecting client
Configure repo and install logstash forwarder
echo 'deb http://packages.elasticsearch.org/logstashforwarder/debian stable main' | sudo tee /etc/apt/sources.list.d/logstashforwarder.list
wget -O - http://packages.elasticsearch.org/GPG-KEY-elasticsearch | sudo apt-key add -
apt-get update
apt-get install logstash-forwarder
Configuration file
vim /etc/logstash-forwarder.conf
{
  # The network section covers network configuration :)
  "network": {
    "servers": [ "log-server.mielnet.pl:8000" ],
    "ssl ca": "/etc/pki/tls/certs/logstash-forwarder.crt",
    "timeout": 15
  },


"files": [
	{
	"paths": [ "/var/log/syslog", "/var/log/auth.log" ],
	"fields": { "type": "syslog" }
	},
        {
        "paths": [ "/var/log/apache2/logstash_*.log" ],
#        "paths": [ "/var/log/apache2/logstash_access_log" ],
#        "paths": [ "/var/log/apache2/logstash_ssl_access_log" ],
#        "paths": [ "/var/log/apache2/logstash_mucm_access_log" ],
        "fields": { "type": "apache-json" },
        "fields": { "codec": "json" }
        },
        {
        "paths": [ "/var/log/apache2/error.log" ],
        "fields": { "type": "apache_error" }
        }
	 ]
}
And last thing, put a copy of your certificate (only cert! keep your key safe on the server!) to /etc/pki/tls/certs/logstash-forwarder.crt
Start service and check daemon logs
/etc/init.d/logstash-forwarder restart
multitail /var/log/logstash-forwarder/*
Troubleshooting
Logstash forwarder
/var/log/logstash-forwarder/
Logstash shipper and processor
/var/log/logstash/
/var/log/logstash-shipper/
Elasticsearch
/var/log/elasticsearch/cluster.log
Redis
redis-cli -h 10.0.0.1
redis 10.0.0.1:6379> llen logstash
(integer) 612099
redis-cli INFO | grep ^db
redis-cli CLIENT LIST
redis-cli monitor

redis-cli LLEN logstash
# will tell you how many items are in the queue currently. Ideally close to 0!

redis-cli LPOP logstash
# will pop an item off the top of the queue / stack and display it to you

redis-cli flushall
# THAT WILL WIPE ALL QUEUED ENTRIES. CAREFULLY WITH THAT ONE.
Outro
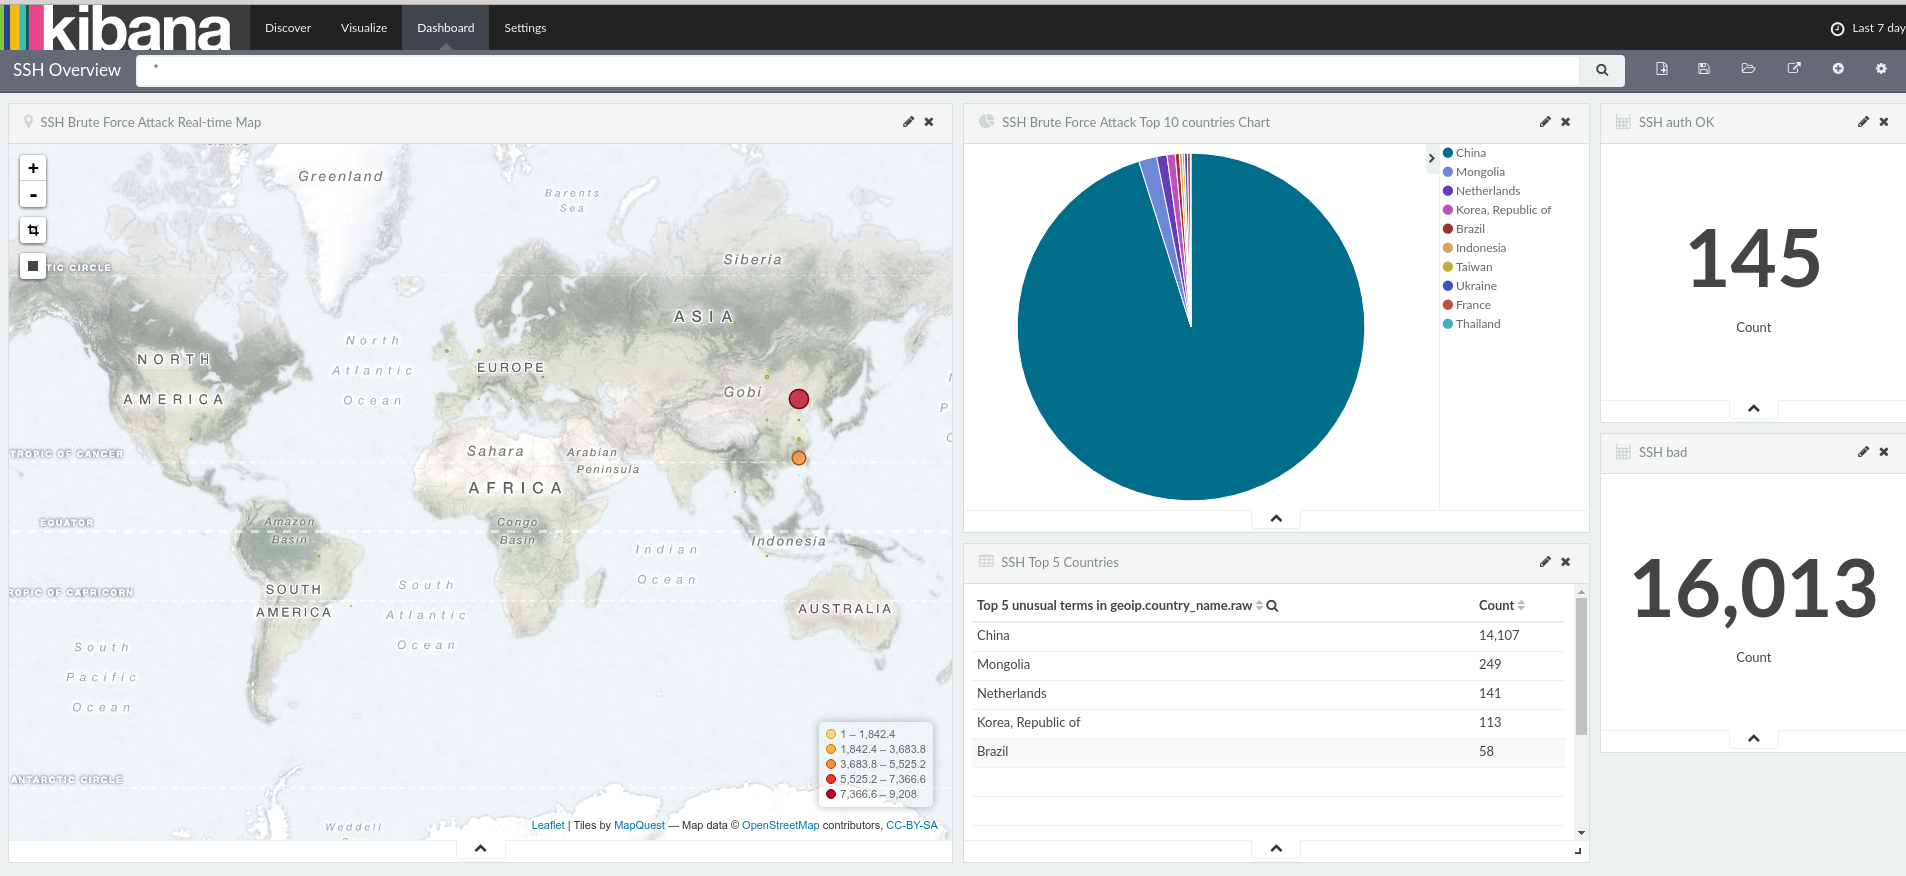
Right, that would be it. I love its functionality and ability to create dashboards – did you know that majority of SSH brute force attacks comes from China? What a surprise! Wonder if they use their shiny new supercomputer for this?
I’ll publish a separate post with my grok filters at some point. Or if I get enough encouragement via comment section below 🙂